VAT = VISUAL ANALYTICS TOOLS
OUR VISION
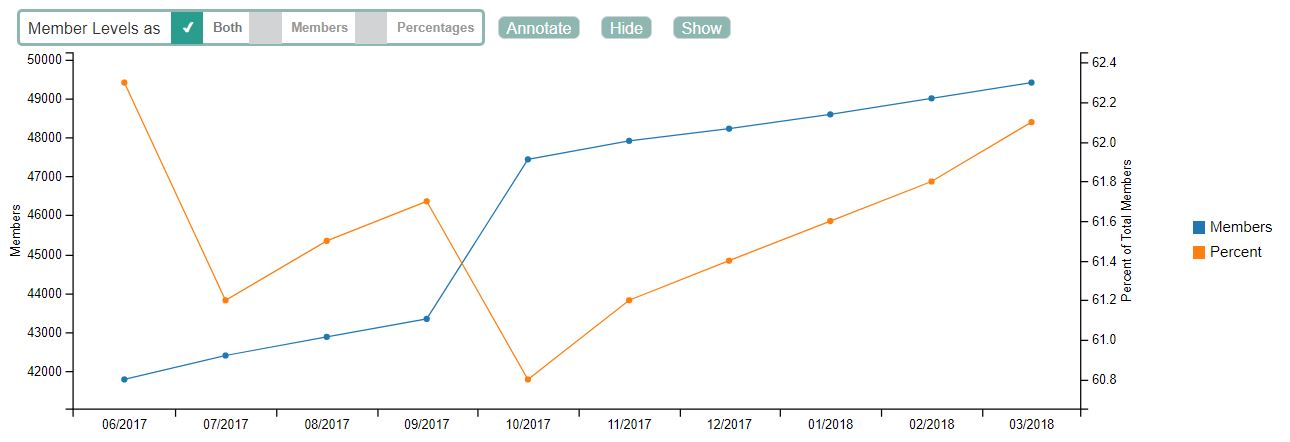
CU*Answers and CU*BASE will have the most extensive and comprehensive Visual Analytics Tools on the market today – more points made through visuals that grab the audience and make the consumer’s grasp of information undeniable. Our hope? This suite of visual analytics tools will help all data analysts grab some attention – you need presentation graphics that catch an audience’s eye and communicate information without distraction.
The Latest VAT Developments!
Each CU*BASE release includes updates and enhancements to the suite of Visual Analytics Tools (VAT) that are built right into CU*BASE GOLD screens or Analytics Booth web pages. Check back often to see what’s coming up and what’s been developed in the past for YOU to get the most value out of the pre-built charts and data tables found in our tools.
Copy/Paste and Save-As
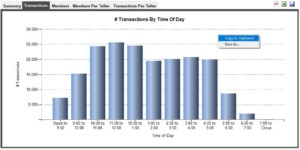
The feature to quickly copy/paste or save a file (PNG) of any chart in CU*BASE (hundreds are available) is available as of May 2019.
On any chart in CU*BASE GOLD, right-click anywhere in the chart and choose “Copy to Clipboard” off the menu (seen to the right in the screenshot below). This clips out just the chart and its title and is ready to paste into anything you like – an email to staff, a board report, an analysis write-up, etc.
As an analysts with Asterisk Intelligence, we use graphics and charts to help data speak visually. They take time to build and refine. This extraction method is intended to make the pre-built GOLD charts simple for you and your staff or analysts to find, use, and share as useful and eye-catching information.
Copy Tables from Screen
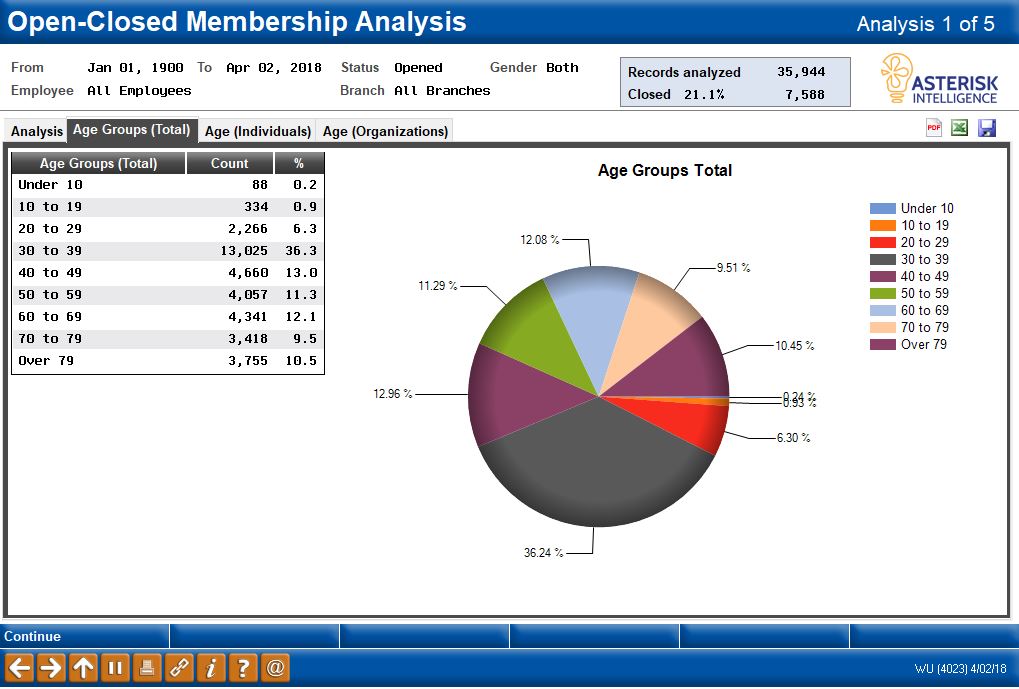
Also available as of May 2019 is the ability to immediately copy a screenshot of certain data tables in CU*BASE to paste into emails or documents and share or analyze.
Simply click the small icon seen in the image below and the entire table of data on-screen is copied to your clipboard as an image, including formatting. Please note that this feature is not available on every table of data in CU*BASE. At this time the feature is attached to data tables that also have at least one chart available.
Pictures and charts are not always the most effective way to communicate the details. If you prefer data tables, or would like to easily and quickly include the source data for a chart you are using from CU*BASE, use this table copy feature to extract the table.
OUR PARTNERSHIPS
GOLD Team
The CU*Answers GOLD and Asterisk Intelligence teams are working together on an initiative to enhance and expand the visual presentations of data within CU*BASE.
Analytics Programming Team
The CU*Answers Analytics Programming & Asterisk Intelligence teams are working to coordinate an expansion into a browser-interface version of several CU*BASE dashboards. These new features will be accessible from directly within CU*BASE and enable working with data and various visual presentation tools right from within a browser environment.